
Why Is Car Insurance So Expensive? Key Factors Explained
This post contains affiliate links. As an Amazon Associate, we earn from qualifying purchases.
Car insurance is expensive because the cost of everything insurers pay for, repairs, medical care, legal settlements, has skyrocketed, while a growing pool of uninsured drivers shifts even more cost onto those who remain insured. The countrywide average premium jumped 14.41% in a single year, and the average repair bill now sits at $4,818, driven by complex sensors and calibrations that add hundreds to every claim.
That 14.41% figure from the National Association of Insurance Commissioners isn’t an outlier. It’s the lagged result of claims costs that have been outpacing premiums for years. Insurers aren’t just raising prices for profit; they’re playing catch-up after a period of severe underwriting losses, and the drivers left holding the policy are funding a system buckling under technological weight and social inflation.
What follows is a breakdown of the three pressure chambers: the physical cost of fixing a modern car, the human cost of a riskier driving environment, and the regulatory lag that lets both problems compound before your bill reflects it. By the end, you’ll see your premium not as a random number, but as the sum of a dozen concrete, documented failures.
Key Takeaways
- The average auto repair bill hit $4,818 in 2025, with calibrations for advanced sensors now appearing in nearly 30% of estimates, adding an average of $485 to each claim.
- More than 1 in 7 drivers (15.4%) had no car insurance in 2023, creating a feedback loop where rising premiums push more people to drop coverage, which in turn raises costs for those still insured.
- Insurers operate on a “combined ratio”, when payouts and expenses exceed 100% of collected premiums, they lose money on underwriting. The industry ran above 100% for consecutive years, forcing drastic rate hikes.
- Your credit score and geographic location are heavily weighted in rate calculations because they are statistically powerful predictors of claim frequency and cost, not because insurers are profiling you.
- Rate increases are slowing but haven’t stopped, because the core pressures, repair complexity, medical inflation, and a growing uninsured pool, show no sign of reversing.
The $4,818 Average Repair Bill That Fuels Your Premium
Forget fender benders. A minor scrape on a modern Toyota RAV4 can now cost $3,000 to fix, compared to about $500 on a 2010 model. The bumper isn’t just plastic; it’s a housing for cameras, parking sensors, and radar units. Bump it, and you’re not just replacing a part, you’re paying for a technician to digitally recalibrate those systems so they don’t misread the road.
The preliminary average Total Cost of Repairs (TCOR) was $4,818 for 2025, an increase of 1.7% over 2024. While that’s the lowest annual increase since 2017, it follows years of double-digit jumps that reset the baseline cost of a claim.
This is the primary, non-negotiable driver. The CCC Intelligent Solutions industry report shows calibrations appeared in 28.3% of all repairable claims in 2025, up from 21.8% the year before. That’s a 30% increase in one year. Each calibration adds an average fee of $485.56. The car is now a computer on wheels, and every repair requires a software update.
Electric vehicles magnify this. They cost, on average, $1,030 more to repair than gas-powered vehicles and need nearly four extra hours of labor. The battery pack itself is a prohibitive expense, but the real cost is in the proprietary systems and specialized training required. This is why EV insurance quotes often come as a shock.
| Repair Cost Driver | Impact on Claim | Why It’s Getting Worse |
|---|---|---|
| ADAS Calibrations | Adds ~$485 per occurrence | By 2028, half of all registered vehicles will have these systems. |
| Electric Vehicle Repairs | +$1,030 & +4 labor hours vs. Gas | EV adoption is accelerating; repair network is still catching up. |
| Parts Inflation & Tariffs | Gradual 2-5% annual cost creep | Geopolitical tensions and trade policies delay rather than eliminate cost pressure. |
| Scan & Diagnostic Fees | Average fee now $149.10 | Modern modules require proprietary scans to even assess damage. |
The body shop invoice is just the start. Medical costs for injuries have inflated dramatically, and legal settlements have ballooned under “social inflation”, the trend of juries awarding larger sums. An insurer’s loss isn’t just the parts and labor on your car; it’s the hospital bill for the other driver’s whiplash and the seven-figure pain-and-suffering judgment that might follow. The actuarial analysis from the CAS spring meeting auto insurance findings lists medical inflation and social inflation as two of the top five cost drivers, right alongside physical repair complexity.
The Uninsured Driver Feedback Loop (15.4% and Climbing)
Here’s the brutal math. When someone with minimal or no insurance causes an accident, the insured driver’s company still pays. Those costs get distributed across all policyholders through higher premiums. As premiums rise, more people on the financial edge find they can no longer afford coverage. They drop it. The pool of uninsured drivers grows, concentrating risk and cost on a smaller group of insured drivers. Premiums rise again.
Where this goes sideways: Thinking high uninsured rates only affect state-mandated programs. The Insurance Research Council found 15.4% of drivers were uninsured in 2023. When you add underinsured drivers, the rate hits 33.4%, one in three. This directly increases the cost of Uninsured/Underinsured Motorist coverage for everyone else, a line item on your bill that’s no longer optional in many areas.
This isn’t a minor leak. It’s a siphon. The Treasury Department auto insurance analysis explicitly links affordability pressures to the growth of the uninsured population. It’s a direct, causal relationship that most articles miss: your rising bill is partly funding the accidents of the person who can’t afford a bill at all.
The states with the highest premiums. Louisiana, Florida, Michigan, consistently have some of the highest uninsured motorist rates. It’s a geographic tax on responsibility. Your ZIP code matters immensely here, as it bundles this population risk with local repair costs, theft rates, and litigation frequency into one rate factor.
How Insurers Lost Money Selling Insurance (The Combined Ratio)
The property and casualty industry has a simple scorecard: the combined ratio. Add up all claims paid (losses) and all operating expenses, then divide by the premiums collected. A ratio below 100% means an underwriting profit. Above 100% means they paid out more than they took in.
For several years leading into 2023, the industry’s combined ratio sat stubbornly above 100%. They were losing money on the core business of selling insurance. Profits, if any, came from investing your premiums before they had to pay claims. When investment income can’t cover underwriting losses, the only move is to raise rates, aggressively.
The state insurance regulators premium data shows the countrywide combined average premium leaping 14.41% in 2023. That wasn’t greed; it was survival. They needed to reset the ratio. It’s a lagging indicator, which is why your premium might spike today for cost trends that began 18 months ago.
What most people get wrong: Blaming “record profits.” In a high-inflation period, insurer profit margins are often thin or negative on the underwriting side. A headline profit figure usually includes global investment gains unrelated to your premium. The part that determines your rate, the underwriting result, has been a bloodbath.
The Rating Factors You Actually Control (And the Ones You Don’t)
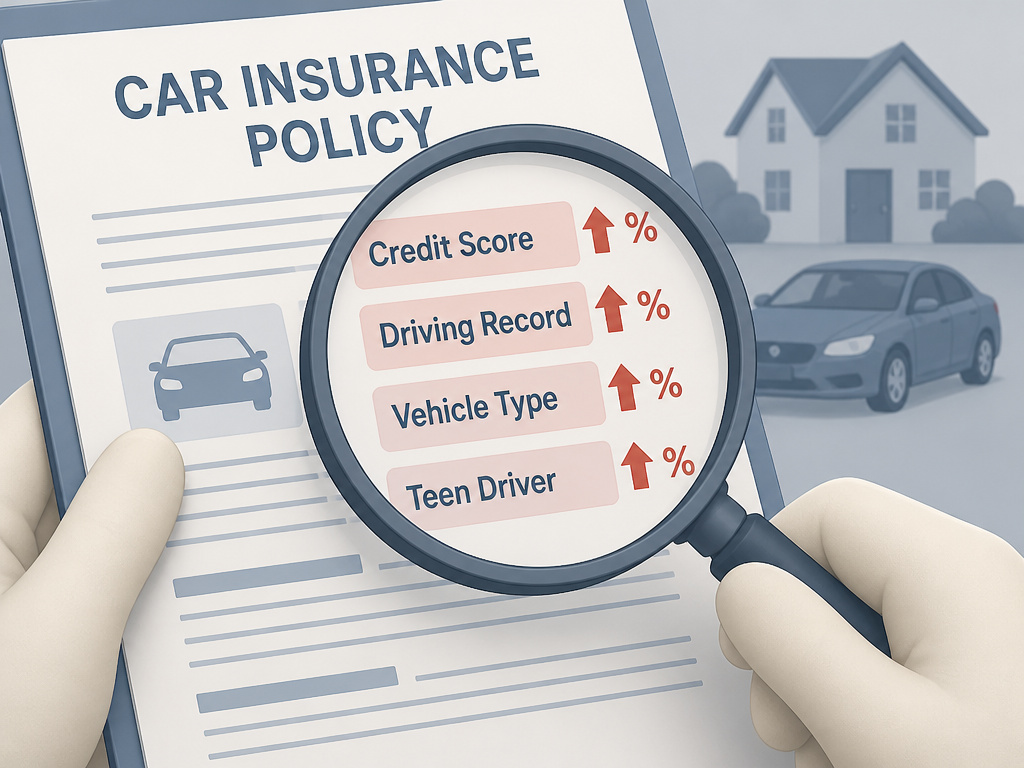
Facing these massive structural costs, insurers become hyper-focused on predicting risk. They’re not just guessing; they’re using decades of data to pinpoint which policyholders are most likely to file a costly claim. This is where personal factors hit your wallet.
- Your Credit-Based Insurance Score: This is the biggest lever after your driving record. It’s not your FICO score, but a model using similar data. Statistically, individuals with lower credit scores file more frequent and more expensive claims. The correlation is so strong that, in most states, it’s a legally approved rating factor. It can easily double your premium.
- Your Driving Record: A single at-fault accident can increase your premium by 30-50% for three to five years. It’s a direct signal of future risk.
- Your Vehicle: A sports car costs more to insure because it’s driven more aggressively, costs more to repair, and is a theft target. A brand-new SUV with every ADAS sensor is also expensive, but for the repair reasons we already covered.
- Your Household: Adding a teen driver is the single most expensive rating change for most families. Inexperience correlates directly with crash probability.
The part nobody mentions: These factors are interdependent. A driver with a poor credit score living in a high-uninsured ZIP code, driving a powerful car, will see multiplicative penalties. The algorithm isn’t adding costs, it’s multiplying risk profiles.
The table below shows how insurers view these variables. They’re not punishments; they are the actuarial translation of probability into price.
| Risk Factor | Why It Increases Premium | Typical Impact |
|---|---|---|
| Low Credit Score | High statistical correlation with claim frequency & severity. | +50% to +100% |
| At-Fault Accident | Demonstrated behavior that predicts future claims. | +30% to +50% for 3-5 years |
| Young Driver (Under 25) | Inexperience leads to higher accident rates. | Can double or triple the policy cost. |
| High-Performance Vehicle | Greater repair cost, higher theft rate, riskier driving behavior. | +25% to +50% vs. A sedan |
Is There Any Relief in Sight?
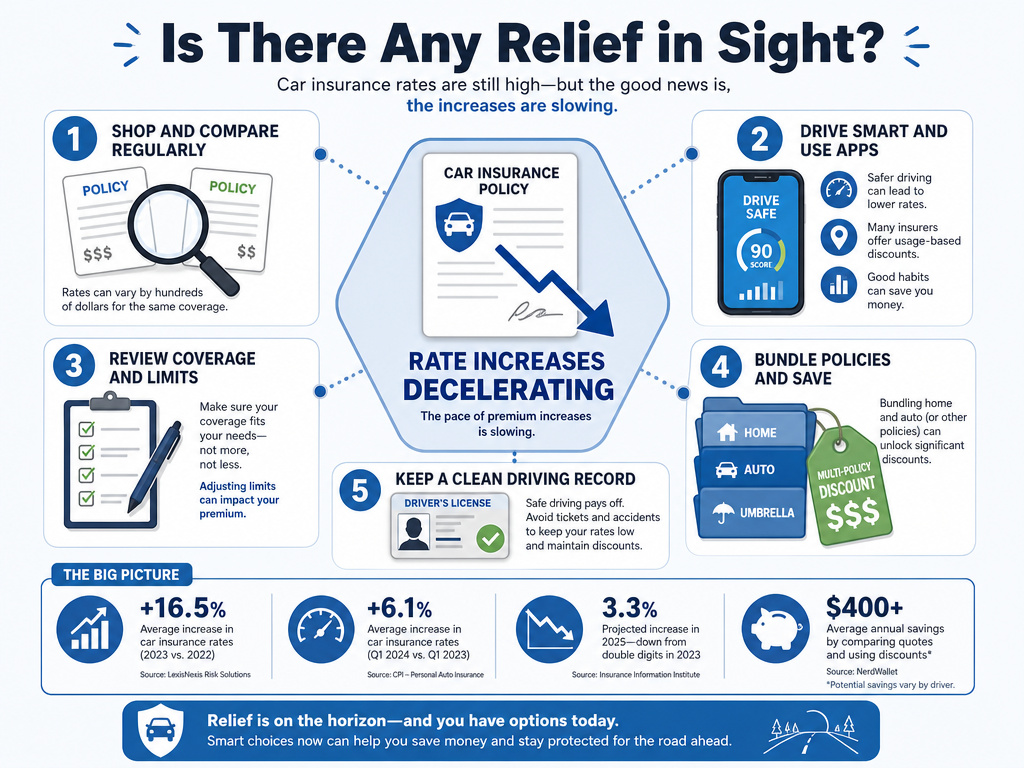
Rate increases are decelerating. After annual jumps exceeding 22% in 2024, the increase for 2025 settled around 6%. The market is finally reaching a new, painful equilibrium where premiums more closely match claims costs. This doesn’t mean your bill will go down. It means the rate of increase might slow to low single digits.
The pressures aren’t vanishing. More ADAS-equipped cars enter the fleet daily. Medical inflation persists. The uninsured driver problem has no quick fix. The only real relief is individual and proactive.
- Shop Your Policy Annually. Loyalty discounts are often outweighed by competitor introductory rates. This is the single most effective action.
- Embrace Telematics. If you’re a safe driver, a usage-based insurance program can provide significant discounts by proving your low risk directly.
- Optimize Your Coverage. Do you need rental car reimbursement if you have a second car? Is your old car’s actual cash value less than your collision deductible plus the premium? Review line by line.
- Bundle and Seek Discounts. Ask about every discount: paperless billing, annual payment plans, defensive driving courses, alumni or professional group affiliations.
- Manage Your Record. A clean driving history is gold. A ticket or accident can haunt your insurance record for years. If you have a claim, learn how to lower your costs after the fact.
The system is reacting to forces larger than any one driver. Your premium is a direct reflection of the cost to keep you and others whole in a world of $5,000 bumper repairs and million-dollar jury awards. Understanding that equation is the first step to managing your place within it.
Frequently Asked Questions
Why did my car insurance go up when I didn’t have an accident?
Your premium is based on the collective risk and cost of everyone in your rating pool, not just your personal history. If repair costs, uninsured driver rates, or severe weather claims soared in your region, every policyholder in that area will see an increase. Your individual clean record just means you didn’t get an additional surcharge on top of the broader market hike.
Are insurance companies just price gouging?
The data from regulatory bodies shows the industry operated at an underwriting loss for years. The combined ratio, measuring claims paid plus expenses against premiums collected, exceeded 100%. The recent premium increases represent a correction to stop losing money on the core product, not arbitrary price gouging. Profit margins in personal auto insurance are historically slim and cyclical.
Will insurance ever get cheaper again?
It’s unlikely to return to pre-2020 levels in real terms. The underlying cost drivers, vehicle technology, medical expense inflation, legal trends, are structural and permanent. The best-case scenario is a period of price stability after the current catch-up phase. Future “savings” will likely come from new models like per-mile telematics policies, not from a broad reduction in standard premiums.
Does driving a cheaper car lower my insurance?
Yes, but with a major caveat. A cheaper, older car can lower your comprehensive and collision coverage costs (since it’s worth less to replace). However, your liability premium, the most expensive part, covering injury and damage you cause to others, is largely unaffected by your car’s value. It’s based on you, the driver. Switching from a new SUV to an old sedan might not save as much as you hope.
How much does my credit score really affect my rate?
In most states, it’s one of the most powerful rating factors, often second only to your driving record. Studies and insurer filings show a low credit-based insurance score can increase your premium by 50% to 100% compared to an excellent score. Insurers use it because their data consistently shows a strong correlation between credit behavior and future claim risk.
The Bottom Line
Car insurance is expensive because the real-world costs it’s designed to cover have entered a new era of complexity. The $4,818 average repair bill, the 15.4% uninsured driver rate, and the years of industry underwriting losses aren’t abstract concepts, they are the itemized reasons on the other side of your bill. While you can’t control market-wide inflation or your neighbor’s decision to drop coverage, you can control your choice of vehicle, your driving habits, and your diligence in shopping for a policy that accurately reflects your risk. The price is a signal. It’s telling you exactly how much it costs to operate a motor vehicle in America today.
